Abbotsford
Household fuel type
In 2018, 0.3% of households in Abbotsford had no access to heating.
Household fuel type indicates the types of fuel used in occupied private dwellings, for heating purposes only (excludes cooking etc.). Fuel types that were used for at least some of the time are measured and does not indicate how long a particular fuel type was used or which was the most used fuel type.
Fuel type use is an infrastructure related topic and can look at the environmental sustainability of dwellings in a particular area, and also address topics such as particulate pollution and solar power uptake. Trends in this variable can be used to monitor energy use and efficiency and target new infrastructure projects.
The ability to heating to households is essential in the colder months and may be dependent on the age and type of the dwelling, as well as its location.
For more information please see related topics such as Household Income, Household Types, Dwelling Types and Housing Tenure.
Please note: There has been a significant change to the Census question for this topic, please refer the specific data note for more information. Stats NZ has given Main types of heating and fuel types used to heat dwellings data for the 2018 Census a quality rating of “moderate”. This indicates there may be some minor issues looking at the comparisons to 2013 and 2006. Users should avoid concluding that any change in the categories is purely due to real world change. See Stats NZ’s DataInfo+ for specific information on what this rating means and recommendations for use.
Derived from the Census question:
'Mark as many spaces as you need to show which types of heating are used most often in this dwelling.'
Multi-response
Occupied private dwellings
| Household fuel type | |||||||||
|---|---|---|---|---|---|---|---|---|---|
| Abbotsford | 2018 | 2013 | Change | ||||||
| Household fuel type - multi-response | Number | % of households | Port Chalmers % | Number | % of households | Port Chalmers % | 2013 to 2018 | ||
| 642 | 58.6 | 56.6 | 594 | 61.7 | 61.1 | +48 | 100 | 1417 | |
| Bottled Gas | 78 | 7.1 | 7.1 | 129 | 13.4 | 11.5 | -51 | 200 | 1417 |
| Coal | 75 | 6.8 | 7.5 | 183 | 19.0 | 20.2 | -108 | 300 | 1417 |
| 930 | 84.9 | 80.2 | 843 | 87.5 | 84.6 | +87 | 400 | 1417 | |
| Solar Power | 0 | 0.0 | 0.0 | 15 | 1.6 | 1.9 | -15 | 500 | 1417 |
| Mains Gas | 0 | 0.0 | 0.0 | 0 | 0.0 | 0.0 | 0 | 600 | 1417 |
| Other Fuel(s) | 9 | 0.8 | 0.5 | 9 | 0.9 | 1.0 | 0 | 700 | 1417 |
| No fuels | 3 | 0.3 | 0.5 | 3 | 0.3 | 0.5 | 0 | 800 | 1417 |
| Not stated/included | 45 | 4.1 | 7.1 | 27 | 2.8 | 5.8 | +18 | 900 | 1417 |
| Total households | 1,095 | 100.0 | 100.0 | 963 | 100.0 | 100.0 | +132 | ||
Source: Statistics New Zealand, Census of Population and Dwellings (opens a new window)
2013 and 2018. Compiled and presented in profile.id by .id (opens a new window)
(informed decisions).
Stats NZ data quality rating: Moderate(opens a new window)
| Household fuel type - Totals | ||||||||
|---|---|---|---|---|---|---|---|---|
| Abbotsford | 2018 | 2013 | Change | |||||
| Household fuel type - totals - multi-response | Number | % of households | Port Chalmers % | Number | % of households | Port Chalmers % | 2013 to 2018 | |
| Not Stated/included | 45 | 4.1 | 7.1 | 900 | 27 | 2.8 | 5.8 | +18 |
| Total households | 1,095 | 100.0 | 100.0 | 1000 | 963 | 100.0 | 100.0 | +132 |
| Total responding households | 1,059 | 96.7 | 94.3 | 1010 | 939 | 97.5 | 94.2 | +120 |
| Total responses | 1,737 | 158.6 | 152.4 | 1020 | 1,776 | 184.4 | 180.8 | -39 |
Source: Statistics New Zealand, Census of Population and Dwellings (opens a new window)
2013 and 2018. Compiled and presented in profile.id by .id (opens a new window)
(informed decisions).
Stats NZ data quality rating: Moderate(opens a new window)
Dominant groups
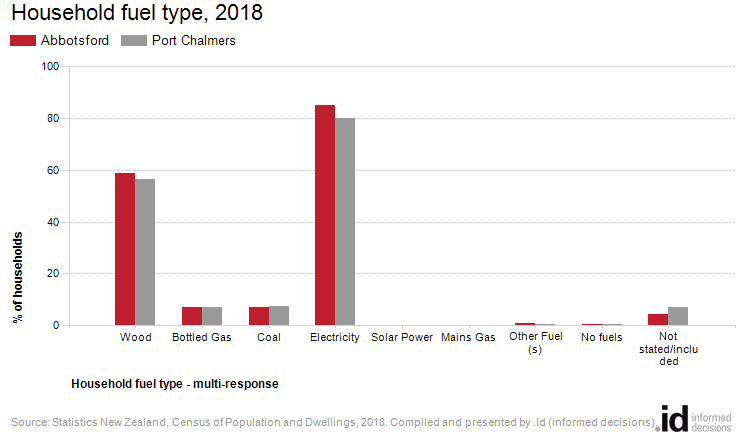
Analysis of the type of fuels used by households for heating in Abbotsford compared to the Port Chalmers shows that there was a higher proportion of households using electricity to generate heat, and a similar proportion of households which did not use heating.
Overall 84.9% of households used electricity to generated heat, and 0.3% did not use heating, compared with 80.2% and 0.5% respectively in the Port Chalmers.
The major differences between the the types of fuels used for generating heat in Abbotsford and the Port Chalmers is:
- A larger percentage of households using electricity to generate heat (84.9% compared to 80.2%)
- A larger percentage of households using wood to generate heat (58.6% compared to 56.6%)
- A smaller percentage of households Not stated/included (4.1% compared to 7.1%)
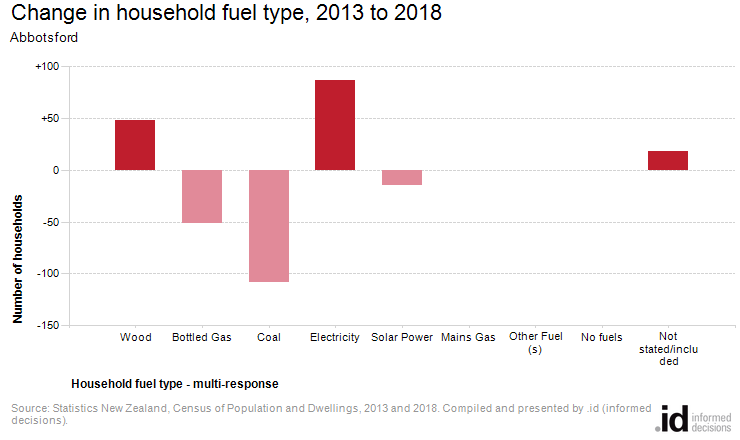
Emerging groups
The largest changes in the types of fuels used by households in Abbotsford, between 2013 and 2018 were:
- Coal (-108 households)
- Electricity (+87 households)
- Bottled Gas (-51 households)