Wairoa District
Current population estimate
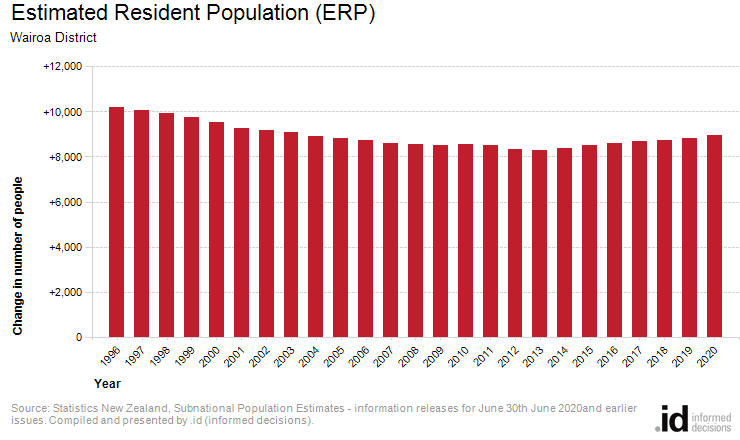
The official population of the Wairoa District as of the 30th June 2020, is 8,960.
Populations are counted and estimated in various ways. The most comprehensive count of the New Zealand population is derived from the Census of Populations and Dwellings conducted by Statistics New Zealand every 5 years.
The census night population count of an area in New Zealand is a count of all people present in that area on a given census night. This count includes visitors from elsewhere in New Zealand and visitors from overseas who are counted in that area on census night, but excludes residents of that area who are temporarily elsewhere in New Zealand or overseas on census night. However the Census count is not the official population of an area.
To provide a more accurate population figure which is updated more frequently than every 5 years, Statistics New Zealand also produces Estimated Resident Population numbers.
The estimated resident population of New Zealand, or an area in New Zealand, is an estimate of all people who usually live in that area at a given date. It is based on the census usually resident population count, updated for residents missed or counted more than once by the census (net census undercount); residents temporarily overseas on census night; and births, deaths and net migration between census night and the date of the estimate.
The population counts published from the census are not comparable with the estimated resident population.
Estimated resident population figures are updated annually as at 30 June, taking into account births, deaths, internal and overseas migration. In addition, after every Census, estimated resident population figures for the 5 previous years are "backcast", using information from the current Census, to ensure the most accurate figures are available.
| Estimated Resident Population (ERP) | |||||||
|---|---|---|---|---|---|---|---|
| Wairoa District | |||||||
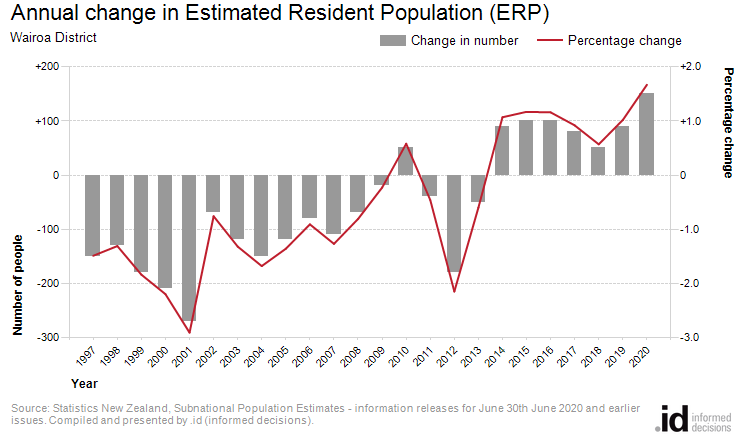
| Year (ending June 30) | Number | Change in number | Change in percent | ||||
| 1996 | 10,200 | -- | -- | 196 | 1 | ||
| 1997 | 10,050 | -150 | -1.5 | 197 | 1 | ||
| 1998 | 9,920 | -130 | -1.3 | 198 | 1 | ||
| 1999 | 9,740 | -180 | -1.8 | 199 | 1 | ||
| 2000 | 9,530 | -210 | -2.2 | 200 | 1 | ||
| 2001 | 9,260 | -270 | -2.9 | 201 | 1 | ||
| 2002 | 9,190 | -70 | -0.8 | 202 | 1 | ||
| 2003 | 9,070 | -120 | -1.3 | 203 | 1 | ||
| 2004 | 8,920 | -150 | -1.7 | 204 | 1 | ||
| 2005 | 8,800 | -120 | -1.4 | 205 | 1 | ||
| 2006 | 8,720 | -80 | -0.9 | 206 | 1 | ||
| 2007 | 8,610 | -110 | -1.3 | 207 | 1 | ||
| 2008 | 8,540 | -70 | -0.8 | 208 | 1 | ||
| 2009 | 8,520 | -20 | -0.2 | 209 | 1 | ||
| 2010 | 8,570 | +50 | +0.6 | 210 | 1 | ||
| 2011 | 8,530 | -40 | -0.5 | 211 | 1 | ||
| 2012 | 8,350 | -180 | -2.2 | 212 | 1 | ||
| 2013 | 8,300 | -50 | -0.6 | 213 | 1 | ||
| 2014 | 8,390 | +90 | +1.1 | 214 | 1 | ||
| 2015 | 8,490 | +100 | +1.2 | 215 | 1 | ||
| 2016 | 8,590 | +100 | +1.2 | 216 | 1 | ||
| 2017 | 8,670 | +80 | +0.9 | 217 | 1 | ||
| 2018 | 8,720 | +50 | +0.6 | 218 | 1 | ||
| 2019 | 8,810 | +90 | +1.0 | 219 | 1 | ||
| 2020 | 8,960 | +150 | +1.7 | 220 | 1 | ||
Source: Statistics New Zealand, Subnational Population Estimates (opens a new window) - information releases for June 30th June 2020. Compiled and presented in profile.id by .id (opens a new window)(informed decisions).