Tainui
Unpaid work
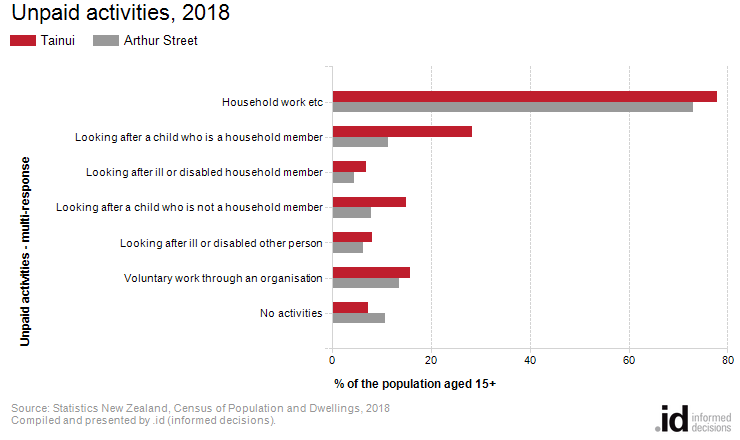
In Tainui 77.9% of the population over 15 did unpaid housework in the 4 weeks leading up to the 2018 census date.
There has been increased interest in identifying, acknowledging and valuing the unpaid work that supports home and community life. The changing amount of time spent on unpaid housework in different Household Types and, particularly the distribution of this work within the household, can indicate the changing roles of males, females and older children in society. The level of unpaid domestic work in Tainui may also be related to Household Income, as higher income households are able to outsource some of these tasks.
Please note: Stats NZ has given Unpaid activities data for the 2018 Census a quality rating of “Poor”. This indicates there may be some issues looking at the comparisons to 2013 and 2006. Users should avoid concluding that any change in the categories is purely due to real world change. See Stats NZ’s DataInfo+ for specific information on what this rating means and recommendations for use.
Derived from the Census question:
'In the last 4 weeks, which of these have you done without pay'
Multi-response
Persons aged 15 years and over
| Unpaid activities | |||||||||
|---|---|---|---|---|---|---|---|---|---|
| Tainui | 2018 | 2006 | Change | ||||||
| Unpaid activities - multi-response | Number | % of total population | Arthur Street % | Number | % of total population | Arthur Street % | 2006 to 2018 | ||
| 1,245 | 77.9 | 73.0 | 1,263 | 84.4 | 81.5 | -18 | 350 | 1465 | |
| Looking after a child who is a household member | 453 | 28.3 | 11.4 | 531 | 35.5 | 19.0 | -78 | 351 | 1465 |
| Looking after ill or disabled household member | 108 | 6.8 | 4.4 | 126 | 8.4 | 5.4 | -18 | 352 | 1465 |
| Looking after a child who is not a household member | 240 | 15.0 | 7.9 | 288 | 19.2 | 12.9 | -48 | 353 | 1465 |
| Looking after ill or disabled other person | 129 | 8.1 | 6.2 | 138 | 9.2 | 8.2 | -9 | 354 | 1465 |
| 252 | 15.8 | 13.6 | 213 | 14.2 | 14.4 | +39 | 355 | 1465 | |
| No activities | 117 | 7.3 | 10.8 | 120 | 8.0 | 8.5 | -3 | 356 | 1465 |
Source: Statistics New Zealand, Census of Population and Dwellings (opens a new window)
2006 and 2018. Compiled and presented in profile.id by .id (opens a new window)
(informed decisions).
Stats NZ data quality rating: Poor(opens a new window)
| Unpaid domestic work - Totals | ||||||||
|---|---|---|---|---|---|---|---|---|
| Tainui | 2018 | 2006 | Change | |||||
| Unpaid activities - totals - multi-response | Number | % of total population | Arthur Street % | Number | % of total population | Arthur Street % | 2006 to 2018 | |
| Not stated / included | 204 | 12.8 | 14.7 | 357 | 78 | 5.2 | 8.2 | +126 |
| Total respondents | 1,395 | 87.2 | 85.3 | 400 | 1,419 | 94.8 | 91.8 | -24 |
| Total responses | 2,748 | 171.9 | 142.0 | 500 | 2,757 | 184.2 | 158.1 | -9 |
| Total population | 1,599 | 100.0 | 100.0 | 9999 | 1,497 | 100.0 | 100.0 | +102 |
Source: Statistics New Zealand, Census of Population and Dwellings (opens a new window)
2006 and 2018. Compiled and presented in profile.id by .id (opens a new window)
(informed decisions).
Stats NZ data quality rating: Poor(opens a new window)
Compiled and presented by .id (informed decisions).
Compiled and presented by .id (informed decisions).
Dominant groups
Analysis of the unpaid activities in Tainui in 2018 compared to the Arthur Street shows that there was a higher proportion of people performing unpaid work in their own home and a higher proportion of people involved with unpaid activities outside of their home.
The major differences between the share of the population performing unpaid domestic work in Tainui and the Arthur Street were:
- A larger percentage of people who looked after a child who is a household member (28.3% compared to 11.4%)
- A larger percentage of people who looked after a child who is not a household member (15.0% compared to 7.9%)
- A larger percentage of people who performed household work etc (77.9% compared to 73.0%)
- A smaller percentage of people with no activities (7.3% compared to 10.8%)
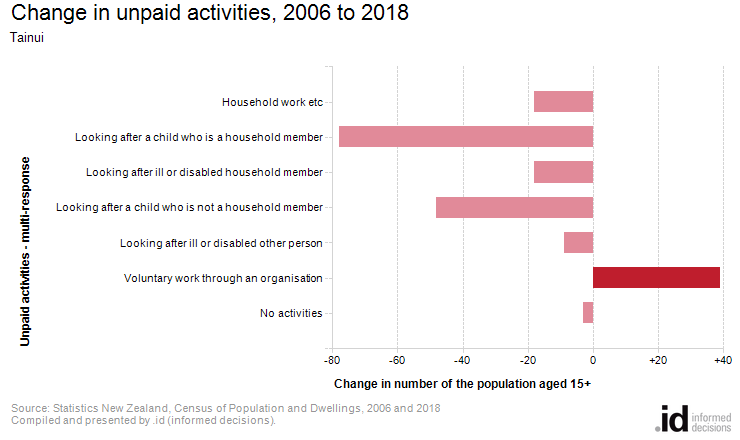
Emerging groups
The largest change in the number of people performing unpaid domestic work in Tainui, between 2006 and 2018 was:
- Looking after a child who is a household member (-78 people)