Momona
Telecommunication access
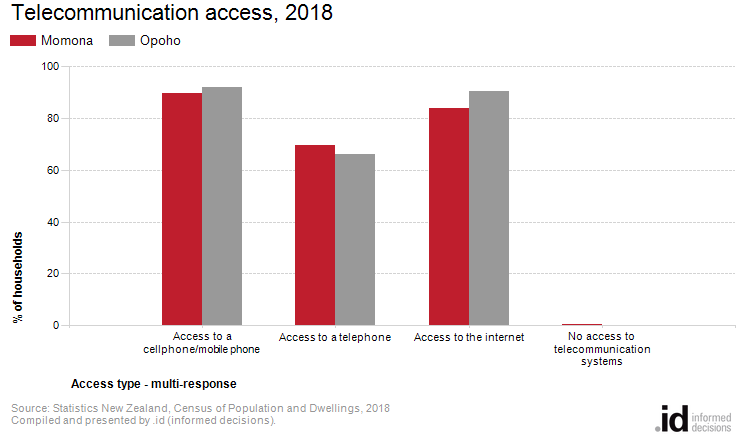
In 2018, 83.9% of homes in Momona had access to the internet.
Telecommunication and Internet statistics indicate the ability of residents in a private dwelling to communicate with people outside the dwelling and to use services provided through these media. Communication information is also used, in conjunction with other census variables, as a measure of social connectedness.
It is widely accepted that high speed internet access is an essential requirement to participate in the so-called "new economy" and households without internet service are increasingly being left behind in the information age, as both government and the private sector are increasingly conducting their business, or aspects of it, on-line.
Telecommunication and Internet statistics are also used, in conjunction with other Census variables such as Education, Household Income and Age Structure, to measure of social connectedness.
Please note: Stats NZ has given Access to telecommunication systems data for the 2018 Census a quality rating of “moderate”. This indicates there may be some minor issues looking at the comparisons to 2013 and 2006. Users should avoid concluding that any change in the categories is purely due to real world change. See Stats NZ’s DataInfo+ for specific information on what this rating means and recommendations for use.
Derived from the Census question:
'Mark as many spaces as you need to show which of these are available here in this dwelling; a cellphone/mobile phone, a telephone, internet access'
Multi-response
Occupied private dwellings
| Telecommunications access | |||||||||
|---|---|---|---|---|---|---|---|---|---|
| Momona | 2018 | 2013 | Change | ||||||
| Connection type - multi-response | Number | % of households | Opoho % | Number | % of households | Opoho % | 2013 to 2018 | ||
| Access to a cellphone/mobile phone | 804 | 89.6 | 91.9 | 723 | 86.4 | 83.4 | +81 | 610 | 1416 |
| Access to a telephone | 624 | 69.6 | 66.3 | 732 | 87.5 | 88.5 | -108 | 612 | 1416 |
| 753 | 83.9 | 90.6 | 663 | 79.2 | 86.6 | +90 | 613 | 1416 | |
| No access to telecommunication systems | 3 | 0.3 | -- | 9 | 1.1 | 0.6 | -6 | 614 | 1416 |
Source: Statistics New Zealand, Census of Population and Dwellings (opens a new window)
2013 and 2018. Compiled and presented in profile.id by .id (opens a new window)
(informed decisions).
Stats NZ data quality rating: Moderate(opens a new window)
| Telecommunications access - Totals | ||||||||
|---|---|---|---|---|---|---|---|---|
| Momona | 2018 | 2013 | Change | |||||
| Telecommunication - totals - multi-response | Number | % of households | Opoho % | Number | % of households | Opoho % | 2013 to 2018 | |
| Not Stated/included | 51 | 5.7 | 1.9 | 615 | 27 | 3.2 | 2.5 | +24 |
| Total households | 897 | 100.0 | 100.0 | 617 | 837 | 100.0 | 100.0 | +60 |
| Total responding households | 846 | 94.3 | 98.1 | 619 | 813 | 97.1 | 98.1 | +33 |
| Total responses | 2,184 | 243.5 | 248.8 | 620 | 2,307 | 275.6 | 267.5 | -123 |
Source: Statistics New Zealand, Census of Population and Dwellings (opens a new window) 2013 and 2018. Compiled and presented in profile.id by .id (opens a new window) (informed decisions).Stats NZ data quality rating: Moderate(opens a new window)
Compiled and presented by .id (informed decisions).
Compiled and presented by .id (informed decisions).
Dominant groups
Analysis of the type of internet connection of households in Momona compared to the Opoho shows that there was a lower proportion of households with access to the internet, as well as a lower proportion of households with access to a cell/mobile phone.
Overall 83.9% of households had with access to the internet, and 89.6% had access to a cell/mobile phone, compared with 90.6% and 91.9% respectively in the Opoho.
Note: Percentages(%) are based on total population
Emerging groups
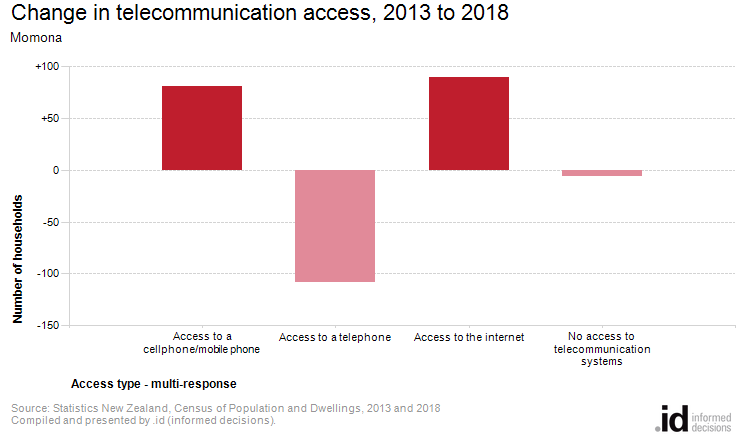
The largest changes in access to telecommunications in Momona, between 2013 and 2018 were:
- Access to a telephone (-108 households)
- Access to the internet (+90 households)
- Access to a cellphone/mobile phone (+81 households)