St Kilda North
Sources of household income
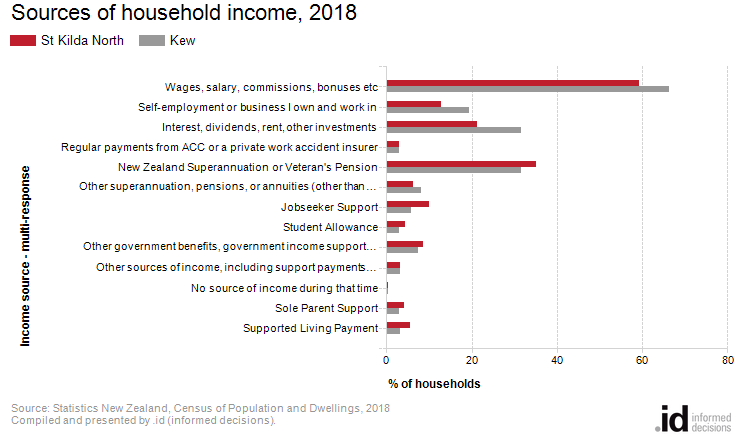
In 2018, Wages, salary, commissions, bonuses etc was the largest source of income in St Kilda North.
Income sources data is a useful addition to Income data as an indicator of socio-economic status. With other data sources, such as Household Income statistics, Educational Qualifications and Occupation data, it helps to evaluate the economic opportunities and socio-economic status of St Kilda North and differentiate between market and non-market source of income. The sources of income that a household relies on are linked to a number of factors:
- The number and age of people in the household;
- The type of employment undertaken by the household members.
- The presence of students in the household; and
- The percentage of people unemployed or on other income support benefits.
Note: Government benefit recipient figures from the 2013 and 2006 Censuses are not directly comparable with 2018 figures. In explanation, welfare reform resulted in changes to benefit categories. Benefits were consolidated into three main groupings: Jobseeker support, sole parent support and supported living payment. The unemployment benefit was moved into jobseeker support, but so was the sickness benefit, domestic purposes/widows benefit for sole parents with children 14 years and over.
Derived from the Census question:
'Show all the ways you yourself got income in the 12 months ending today (excluding loans because they are not income)?'
Multi-response
Persons aged 15 years and over
| Sources of household income | |||||||||
|---|---|---|---|---|---|---|---|---|---|
| St Kilda North | 2018 | 2013 | Change | ||||||
| Income source - multi-response | Number | % of households | Kew % | Number | % of households | Kew % | 2013 to 2018 | ||
| Wages, salary, commissions, bonuses etc | 648 | 59.3 | 66.3 | 300 | 603 | 56.0 | 67.8 | +45 | 1412 |
| Self-employment or business I own and work in | 141 | 12.9 | 19.3 | 301 | 117 | 10.9 | 17.2 | +24 | 1412 |
| Interest, dividends, rent, other investments | 231 | 21.2 | 31.7 | 302 | 255 | 23.7 | 34.8 | -24 | 1412 |
| Regular payments from ACC or a private work accident insurer | 33 | 3.0 | 2.9 | 303 | 21 | 1.9 | 2.2 | +12 | 1412 |
| New Zealand Superannuation or Veteran's Pension | 384 | 35.2 | 31.7 | 304 | 366 | 34.0 | 26.9 | +18 | 1412 |
| Other superannuation, pensions, or annuities (other than NZ Superannuation, Veteran's Pension or war pensions) | 69 | 6.3 | 8.2 | 305 | 66 | 6.1 | 8.8 | +3 | 1412 |
| Jobseeker Support | 108 | 9.9 | 5.8 | 307 | 93 | 8.6 | 5.3 | +15 | 1412 |
| Student Allowance | 48 | 4.4 | 2.9 | 310 | 54 | 5.0 | 3.1 | -6 | 1412 |
| Other government benefits, government income support payments, war pensions or paid parental leave | 93 | 8.5 | 7.4 | 311 | 96 | 8.9 | 8.8 | -3 | 1412 |
| Other sources of income, including support payments from people who do not live in my household | 36 | 3.3 | 3.3 | 312 | 42 | 3.9 | 5.3 | -6 | 1412 |
| No source of income during that time | 3 | 0.3 | 0.4 | 313 | 9 | 0.8 | 0.4 | -6 | 1412 |
| Sole Parent Support | 45 | 4.1 | 2.9 | 315 | 48 | 4.5 | 4.0 | -3 | 1412 |
| Supported Living Payment | 60 | 5.5 | 3.3 | 316 | 57 | 5.3 | 3.1 | +3 | 1412 |
Source: Statistics New Zealand, Census of Population and Dwellings (opens a new window)
2013 and 2018. Compiled and presented in profile.id by .id (opens a new window)
(informed decisions).
Stats NZ data quality rating: Moderate(opens a new window)
| Sources of household income - responses | ||||||||
|---|---|---|---|---|---|---|---|---|
| St Kilda North | 2018 | 2013 | Change | |||||
| Income source - totals - multi-response | Number | % of households | Kew % | Number | % of households | Kew % | 2013 to 2018 | |
| Not stated | 314 | 27 | 2.5 | 3.0 | 39 | 3.8 | 3.2 | -12 |
| Total responding households | 350 | 1,038 | 97.5 | 97.0 | 999 | 96.2 | 96.8 | +39 |
| Total responses | 400 | 2,946 | -- | -- | 2,856 | -- | -- | +90 |
| Total households stated | 999 | 1,065 | 100.0 | 100.0 | 1,038 | 100.0 | 100.0 | +27 |
Source: Statistics New Zealand, Census of Population and Dwellings (opens a new window)
2013 and 2018. Compiled and presented in profile.id by .id (opens a new window)
(informed decisions).
Stats NZ data quality rating: Moderate(opens a new window)
Compiled and presented by .id (informed decisions).
Compiled and presented by .id (informed decisions).
Dominant groups
Analysis of St Kilda North's income sources in 2018 compared to Kew income sources shows that there was a lesser proportion of households who identified wages and salaries as an income source, a lesser proportion of households who identified self employment or business as an income source, and a greater proportion that identified government benefits as an income source.
Overall, 59.3% of households identified wages and salaries, 12.9% self employment or business, and 22.8% government benefits as an income source, compared with 66.3%, 19.3% and 16.0% for the Kew respectively.
The major differences between sources of household income of the population in St Kilda North and Kew were:
- A larger percentage of Jobseeker Support as an income source (9.9% compared to 5.8%)
- A smaller percentage of Interest, dividends, rent, other investments as an income source (21.2% compared to 31.7%)
- A smaller percentage of Wages, salary, commissions, bonuses etc as an income source (59.3% compared to 66.3%)
- A smaller percentage of Self-employment or business I own and work in as an income source (12.9% compared to 19.3%)
Note: Percentages(%) are based on total population
Emerging groups
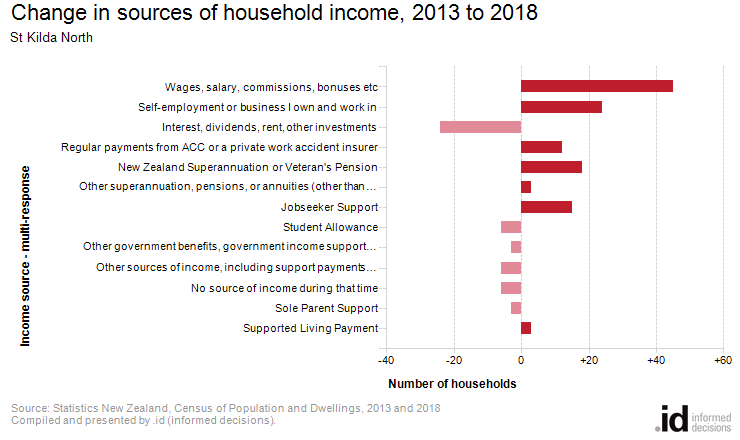
The largest changes in sources of household income of the population in St Kilda North between 2013 and 2018 were:
- Wages, salary, commissions, bonuses etc (+45 households)
- Self-employment or business I own and work in (+24 households)
- Interest, dividends, rent, other investments (-24 households)
- New Zealand Superannuation or Veteran's Pension (+18 households)