Dunedin Central - Harbourside
Service age groups
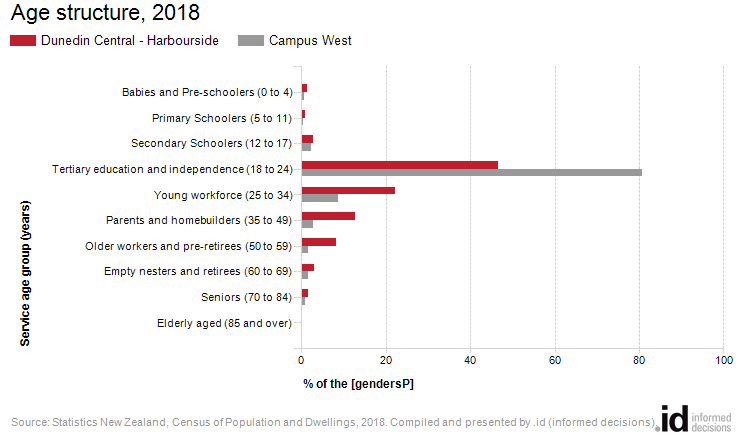
Dunedin Central - Harbourside had a higher proportion of [gender] pre-schoolers and a higher proportion of [gendersP] at post retirement age than Campus West in 2018.
The Age Structure of the population is the most widely used component of the Census. It is an indicator of an area’s residential role and function and how it is likely to change in the future. Dunedin Central - Harbourside's age demographics are indicative of the area’s era of settlement and provide key insights into the level of demand for services and facilities (as most services and facilities are age-specific).
Service age groups divide the population into age categories that reflect typical life-stages. They indicate the level of demand for services that target people at different stages in life and how that demand is changing.
To get a more complete picture of Dunedin Central - Harbourside's demographic characteristics, Dunedin Central - Harbourside's Age Structure should be viewed in conjunction with Family and Household type data.
Derived from the Census question:
'When were you born?'
Total population
| Age structure - Service age groups | |||||||||
|---|---|---|---|---|---|---|---|---|---|
| Dunedin Central - Harbourside - Total [genders] | 2018 | 2013 | Change | ||||||
| Service age group (years) | Number | % | Campus West % | Number | % | Campus West % | 2013 to 2018 | ||
| 27 | 1.4 | 0.7 | 18 | 0.9 | 0.7 | +9 | 1020 | 1400 | |
| 18 | 0.9 | 0.5 | 21 | 1.1 | 0.0 | -3 | 1021 | 1400 | |
| 54 | 2.7 | 2.3 | 33 | 1.7 | 3.6 | +21 | 1022 | 1400 | |
| 924 | 46.5 | 80.8 | 1,059 | 54.6 | 82.8 | -135 | 1023 | 1400 | |
| 444 | 22.4 | 8.7 | 372 | 19.2 | 6.1 | +72 | 1024 | 1400 | |
| 252 | 12.7 | 2.8 | 189 | 9.7 | 2.2 | +63 | 1025 | 1400 | |
| Older workers and pre-retirees (50 to 59) | 165 | 8.3 | 1.7 | 156 | 8.0 | 2.2 | +9 | 1026 | 1400 |
| Empty nesters and retirees (60 to 69) | 63 | 3.2 | 1.6 | 63 | 3.2 | 1.4 | 0 | 1027 | 1400 |
| Seniors (70 to 84) | 33 | 1.7 | 1.0 | 30 | 1.5 | 1.1 | +3 | 1028 | 1400 |
| 6 | 0.3 | 0.0 | 0 | 0.0 | 0.0 | +6 | 1029 | 1400 | |
| Total [gendersPop] | 1,986 | 100.0 | 100.0 | 1,941 | 100.0 | 100.0 | +45 | ||
Source: Statistics New Zealand, Census of Population and Dwellings (opens a new window) 2013 and 2018. Compiled and presented in profile.id by .id (opens a new window)(informed decisions).Stats NZ data quality rating: Very high(opens a new window)
Dominant groups
Analysis of the service age groups of Dunedin Central - Harbourside in 2018 compared to the Campus West shows that there was a higher proportion of [gendersP] in the younger age groups (0 to 17 years) as well as a higher proportion of [gendersP] in the older age groups (60+ years).
Overall, 5.0% of the [gender] population was aged between 0 and 17, and 5.1% were aged 60 years and over, compared with 3.5% and 2.6% respectively for the Campus West.
The major differences between the [gender] age structure of Dunedin Central - Harbourside and the Campus West were:
- A larger percentage of 'Young workforce (25 to 34)' (22.4% compared to 8.7%)
- A larger percentage of 'Parents and homebuilders (35 to 49)' (12.7% compared to 2.8%)
- A larger percentage of 'Older workers and pre-retirees (50 to 59)' (8.3% compared to 1.7%)
- A smaller percentage of 'Tertiary education and independence (18 to 24)' (46.5% compared to 80.8%)
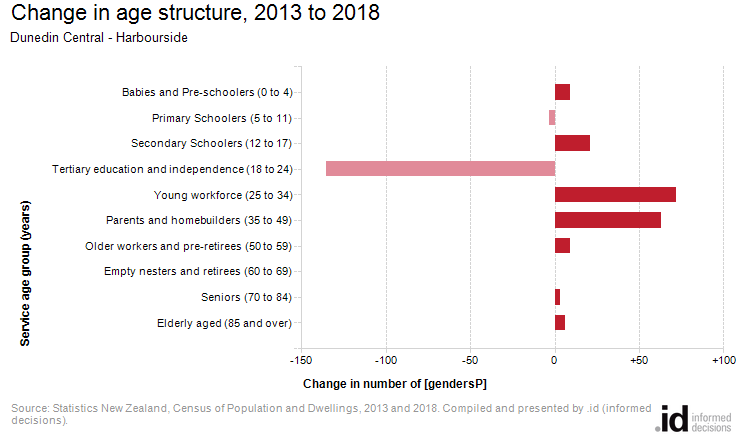
Emerging groups
From 2013 to 2018, Dunedin Central - Harbourside's [gender] population increased by 45 [gendersP] (2.3%). This represents an average annual [gender] population change of 0.46% per year over the period.
The largest changes in the [gender] age structure in this area between 2013 and 2018 were in the age groups:
- Tertiary education and independence (18 to 24) (-135 [genders])
- Young workforce (25 to 34) (+72 [genders])
- Parents and homebuilders (35 to 49) (+63 [genders])