Bucklands Crossing
Qualifications
354 people in Bucklands Crossing had a tertiary qualification in 2018.
Education Qualifications are one of the most important indicators of socio-economic status. With other data sources, such as Income statistics and Occupation data, Bucklands Crossing's Education Qualifications help to evaluate the economic opportunities and socio-economic status of an area and identify skill gaps in the labour market. Level of Educational Qualifications in a population relate to a number of factors including:
- The age of the population (e.g. older people tend to have more vocational qualifications, while people in their twenties and thirties are more likely to have a university degree);
- The professional or working ambitions of people (to seek education as youth or retraining as adults);
- The opportunities afforded to people to continue studying beyond compulsory schooling; and
- Immigration policy
Please note: Stats NZ has given Qualifications data for the 2018 Census a quality rating of “moderate”. This indicates there may be some minor issues looking at the comparisons to 2013 and 2006. Users should avoid concluding that any change in the categories is purely due to real world change. See Stats NZ’s DataInfo+ for specific information on what this rating means and recommendations for use.
Derived from the Census questions:
'What is your highest secondary school qualification?', 'Apart from secondary school qualifications do you have another completed qualification?', and 'What is your highest qualification?'
Persons aged 15 years and over
| Highest qualification achieved | |||||||||
|---|---|---|---|---|---|---|---|---|---|
| Bucklands Crossing | 2018 | 2013 | Change | ||||||
| Qualification level | Number | % | Ravensbourne-St Leonards % | Number | % | Ravensbourne-St Leonards % | 2013 to 2018 | ||
| Higher degree | 195 | 16.0 | 20.8 | 680 | 126 | 11.1 | 13.3 | +69 | 1436 |
| Bachelor degree | 159 | 13.0 | 13.2 | 681 | 147 | 13.0 | 14.2 | +12 | 1436 |
| Post school (excluding university) | 327 | 26.8 | 26.5 | 682 | 282 | 24.9 | 25.1 | +45 | 1436 |
| School qualification | 270 | 22.1 | 22.7 | 683 | 288 | 25.5 | 25.3 | -18 | 1436 |
| 210 | 17.2 | 13.5 | 684 | 192 | 17.0 | 14.4 | +18 | 1436 | |
| Not stated / included | 60 | 4.9 | 3.2 | 685 | 96 | 8.5 | 7.6 | -36 | 1436 |
| Total population aged 15+ | 1,221 | 100.0 | 100.0 | 1,131 | 100.0 | 100.0 | +90 | ||
Source: Statistics New Zealand, Census of Population and Dwellings (opens a new window) 2013 and 2018. Compiled and presented in profile.id by .id (opens a new window)(informed decisions).
Stats NZ data quality rating: Moderate(opens a new window)
Compiled and presented by .id (informed decisions).
Compiled and presented by .id (informed decisions).
Dominant groups
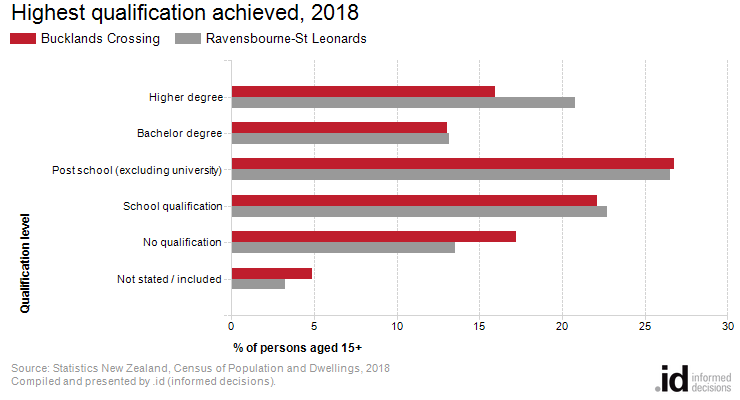
Analysis of the qualifications of the population in Bucklands Crossing in 2018 compared to the Ravensbourne-St Leonards shows that there was a lower proportion of people holding formal qualifications (Higher degrees, Bachelor degrees and Post School (excluding university) qualifications), and a higher proportion of people with no formal qualifications.
Overall, 77.9% of the population aged 15 and over held educational qualifications, and 17.2% had no qualifications, compared with 83.2% and 13.5% respectively for the Ravensbourne-St Leonards.
The major differences between qualifications held by the population of Bucklands Crossing and the Ravensbourne-St Leonards were:
- A larger percentage of persons with No qualifications (17.2% compared to 13.5%)
- A smaller percentage of persons with Higher degrees (16.0% compared to 20.8%)
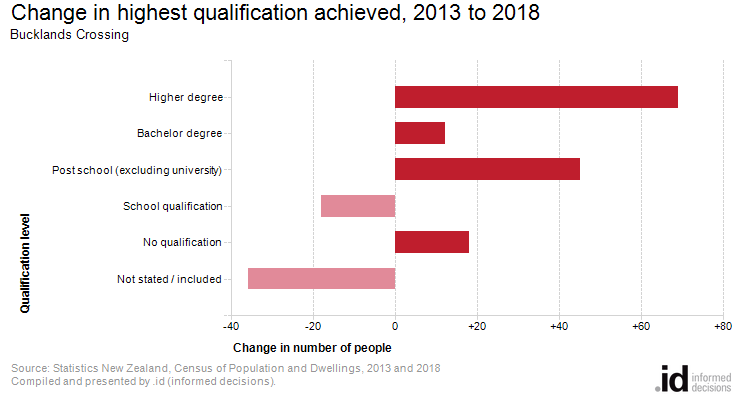
Emerging groups
The largest change in the qualifications of the population in Bucklands Crossing between 2013 and 2018 was:
- Higher degrees (+69 persons)