Calton Hill
Overseas arrivals
213 people who were living in Calton Hill were born overseas and 21.1% arrived in New Zealand within 5 years prior to 2018.
The Year of Arrival data records when the overseas born population arrived in New Zealand. The data shows the degree to which areas are 'ports' for new overseas migrants and reveals the role of Calton Hill in housing the overseas-born. The number of recent arrivals in an area is often determined by housing affordability, employment opportunities and pre-existing communities located in the area.
Calton Hill's Year of Arrival data, when used with Country of Birth, Religion and Languages Spoken data, is a good indicator of the likely need for services in migrant communities.
Please note: Stats NZ has given Years since arrival in New Zealand data for the 2018 Census a quality rating of “moderate”. See Stats NZ’s DataInfo+ for specific information on what this rating means and recommendations for use.
Derived from the Census question:
'When did you first arrive to live in New Zealand?'
Overseas born population
| Overseas arrivals | |||||
|---|---|---|---|---|---|
| Calton Hill | 2018 | ||||
| Year of arrival in New Zealand | Number | % | Fernhill % | ||
| Prior to 1991 | 51 | 23.9 | 10.9 | 361 | 1428 |
| 1991 to 2000 | 15 | 7.0 | 7.7 | 362 | 1428 |
| 2001 to 2005 | 27 | 12.7 | 9.3 | 363 | 1428 |
| 2006 to 2012 | 48 | 22.5 | 18.0 | 364 | 1428 |
| 2013 to March 2018 | 45 | 21.1 | 36.1 | 365 | 1428 |
| Not stated / included | 27 | 12.7 | 18.0 | 370 | 1428 |
| Total | 213 | 100.0 | 100.0 | ||
Source: Statistics New Zealand, Census of Population and Dwellings (opens a new window) 2018. Compiled and presented by .id (opens a new window)(informed decisions).
Stats NZ data quality rating: Moderate(opens a new window)
Compiled and presented by .id (informed decisions).
Dominant groups
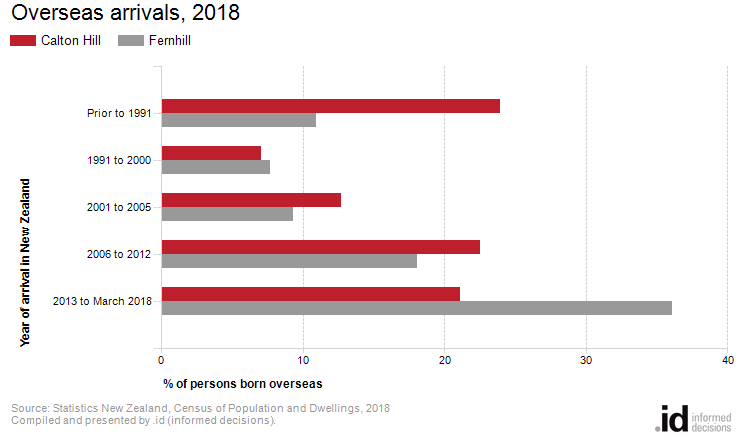
Analysis of the year of arrival for the overseas born population of Calton Hill in 2018 compared to the Fernhill shows that there was a larger proportion of people who arrived before 1991, and a smaller proportion of recent arrivals (those who arrived between 2013 and 2018).
Overall, 31.0% of the overseas born population arrived before 1991, and 21.1% arrived during or after 2013, compared with 18.6% and 36.1% respectively for the Fernhill.
The major differences between the year of arrival data of Calton Hill and the Fernhill were:
- A larger percentage of arrivals prior to 1991 (23.9% compared to 10.9%)
- A larger percentage of arrivals in 2001 (22.5% compared to 18.0%)
- A larger percentage of arrivals between 1996 to 2000 (12.7% compared to 9.3%)
- A smaller percentage of arrivals in 2002 (21.1% compared to 36.1%)