Ravensbourne-St Leonards
Occupation of employment
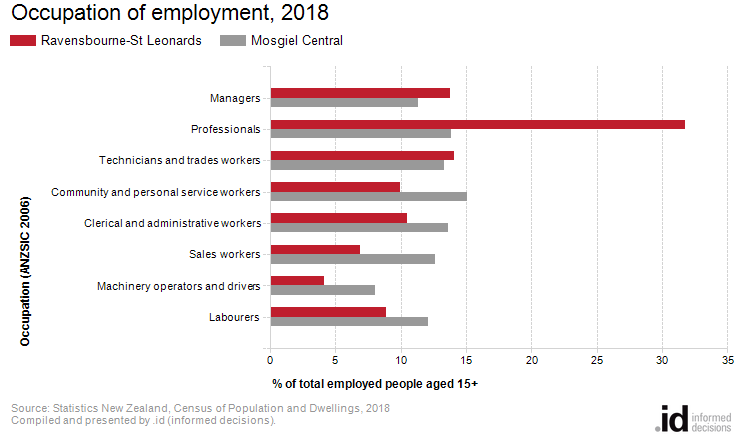
There were more professionals in Ravensbourne-St Leonards than any other occupation in 2018.
Ravensbourne-St Leonards's occupation statistics quantify the occupations in which the residents work (which may be within the residing area or elsewhere). This will be influenced by the economic base and employment opportunities available in the area, education levels, and the working and social aspirations of the population. When viewed with other indicators, such as Educational Qualifications and Individual Income, Occupation is a key measure for evaluating Ravensbourne-St Leonards's socio-economic status and skill base. The occupations held by a workforce are linked to a range of factors including:
- The economic base and employment opportunities available in the area;
- The educational qualification levels of the population; and
- The working and social aspirations of the population.
Please note: Stats NZ has given Occupation data for the 2018 Census a quality rating of “moderate”. This indicates there may be some minor issues looking at the comparisons to 2013 and 2006. Users should avoid concluding that any change in the categories is purely due to real world change. See Stats NZ’s DataInfo+ for specific information on what this rating means and recommendations for use.
Derived from the Census questions:
'In the job that you worked the most hours in, what was your occupation?'
Persons aged 15 years and over
| Occupation of employment | ||||||||
|---|---|---|---|---|---|---|---|---|
| Ravensbourne-St Leonards | 2018 | 2013 | Change | |||||
| Occupation | Number | % | Mosgiel Central % | Number | % | Mosgiel Central % | 2013 to 2018 | |
| Managers | 150 | 13.8 | 11.3 | 114 | 11.3 | 11.6 | +36 | 700 |
| Professionals | 345 | 31.8 | 13.9 | 303 | 30.1 | 12.9 | +42 | 701 |
| Technicians and trades workers | 153 | 14.1 | 13.4 | 135 | 13.4 | 13.8 | +18 | 702 |
| Community and personal service workers | 108 | 9.9 | 15.1 | 105 | 10.4 | 12.1 | +3 | 703 |
| Clerical and administrative workers | 114 | 10.5 | 13.6 | 123 | 12.2 | 13.5 | -9 | 704 |
| Sales workers | 75 | 6.9 | 12.6 | 57 | 5.7 | 12.1 | +18 | 705 |
| Machinery operators and drivers | 45 | 4.1 | 8.1 | 42 | 4.2 | 7.2 | +3 | 706 |
| Labourers | 96 | 8.8 | 12.1 | 96 | 9.6 | 12.9 | 0 | 708 |
| Not stated / included | -- | -- | -- | 30 | 3.0 | 3.9 | -30 | 709 |
| Total employed population aged 15+ | 1,086 | 100.0 | 100.0 | 1,005 | 100.0 | 100.0 | +81 | |
Source: Statistics New Zealand, Census of Population and Dwellings (opens a new window)
2013 and 2018. Compiled and presented in profile.id by .id (opens a new window)(informed decisions).
Stats NZ data quality rating: Moderate(opens a new window)
Please note that in the 2018 Census, where data are not provided, responses are sourced from administrative datasets, in line with the procedures developed by Statistics New Zealand to supplement the 2018 dataset. Due to this, there is no "Not Stated / included" category in 2018, and users should use caution when comparing to earlier Census years.
Compiled and presented by .id (informed decisions).
Compiled and presented by .id (informed decisions).
Dominant groups
An analysis of the jobs held by the resident population in Ravensbourne-St Leonards in 2018 shows the three most popular occupations were:
- Professionals (345 people or 31.8%)
- Technicians and trades workers (153 people or 14.1%)
- Managers (150 people or 13.8%)
In combination these three occupations accounted for 648 people in total or 59.7% of the employed resident population.
In comparison, the Mosgiel Central employed 13.9% in Professionals; 13.4% in Technicians and trades workers; and 11.3% in Managers.
The major differences between the jobs held by the population of Ravensbourne-St Leonards and the Mosgiel Central were:
- A larger percentage of persons employed as Professionals (31.8% compared to 13.9%)
- A smaller percentage of persons employed as Sales workers (6.9% compared to 12.6%)
- A smaller percentage of persons employed as Community and personal service workers (9.9% compared to 15.1%)
- A smaller percentage of persons employed as Machinery operators and drivers (4.1% compared to 8.1%)
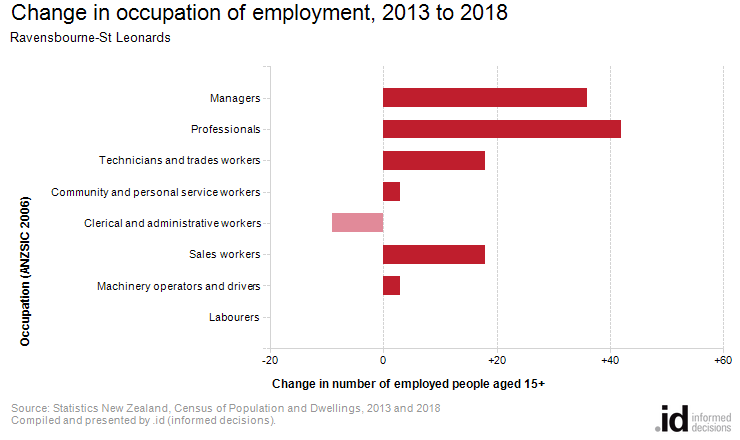
Emerging groups
The number of employed people in Ravensbourne-St Leonards increased by 81 between 2013 and 2018.
There were no major differences in Ravensbourne-St Leonards between 2013 and 2018.