Waikouaiti
Individual income
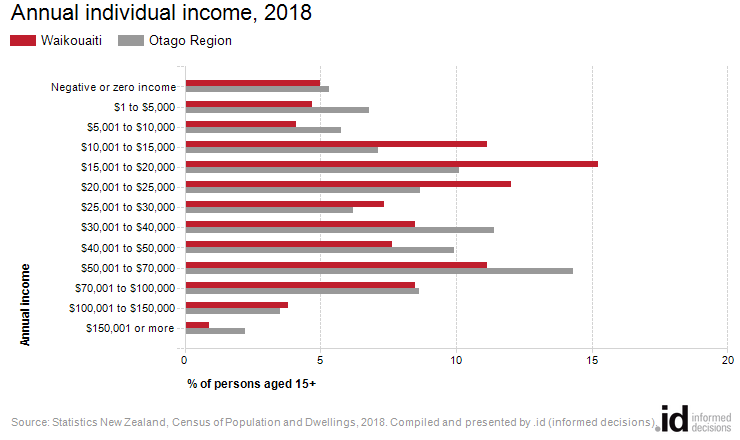
In Waikouaiti, 11.1% people earned an income of $70,000 or more per annum in 2018.
Individual Income statistics are an indicator of socio-economic status. With other data sources, such as Household Income, Educational Qualifications and Occupation, they help tell the story of the economic opportunities and socio-economic status of Waikouaiti. The amount of income an individual receives is linked to a number of factors including Employment Status, Age (as for instance students and retirees often receive a lower income), qualifications and type of employment.
The incomes presented on this page are for the latest Census year only. For comparison of incomes over time, go to Individual Income Quartiles.
Derived from the Census question:
'From all sources of income identified, what will the total income be:
- that you got yourself
- before tax or anything was taken out of it
- in the 12 months that will end on 31 March 2018'
Persons aged 15 years and over
| Annual individual income | |||||||
|---|---|---|---|---|---|---|---|
| Waikouaiti | 2018 | ||||||
| Annual income | Number | % | Otago Region % | ||||
| Negative or zero income | 51 | 5.0 | 5.3 | 250 | |||
| $1 to $5,000 | 48 | 4.7 | 6.8 | 251 | |||
| $5,001 to $10,000 | 42 | 4.1 | 5.8 | 252 | |||
| $10,001 to $15,000 | 114 | 11.1 | 7.1 | 253 | |||
| $15,001 to $20,000 | 156 | 15.2 | 10.1 | 254 | |||
| $20,001 to $25,000 | 123 | 12.0 | 8.7 | 255 | |||
| $25,001 to $30,000 | 75 | 7.3 | 6.2 | 256 | |||
| $30,001 to $40,000 | 87 | 8.5 | 11.4 | 257 | |||
| $40,001 to $50,000 | 78 | 7.6 | 9.9 | 259 | |||
| $50,001 to $70,000 | 114 | 11.1 | 14.3 | 260 | |||
| $70,001 to $100,000 | 87 | 8.5 | 8.6 | 262 | |||
| $100,001 to $150,000 | 39 | 3.8 | 3.5 | 263 | |||
| $150,001 or more | 9 | 0.9 | 2.2 | 264 | |||
| Total population aged 15+ | 1,023 | 100.0 | 100.0 | ||||
Source: Statistics New Zealand, Census of Population and Dwellings (opens a new window)
2018. Compiled and presented in profile.id by .id (opens a new window)(informed decisions).
Stats NZ data quality rating: High(opens a new window)
Dominant groups
Analysis of individual income levels in Waikouaiti in 2018 compared to the Otago Region shows that there was a lower proportion of persons earning a high income (those earning more than $70,000 per annum) and a similar proportion of low income persons (those earning less than $15,000 per annum).
Overall, 11.1% of the population earned a high income, and 24.9% earned a low income, compared with 14.3% and 25.0% respectively for the Otago Region.
The major differences between Waikouaiti's individual incomes and the Otago Region's individual incomes were:
- A larger percentage of persons who earned $15,001 to $20,000 (15.2% compared to 10.1%)
- A larger percentage of persons who earned $10,001 to $15,000 (11.1% compared to 7.1%)
- A larger percentage of persons who earned $20,001 to $25,000 (12.0% compared to 8.7%)
- A smaller percentage of persons who earned $50,001 to $70,000 (11.1% compared to 14.3%)