North East Valley Knox
Housing rental payments
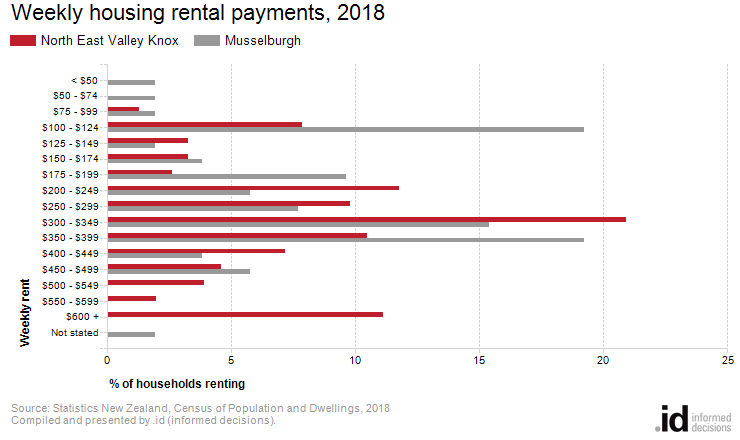
In North East Valley Knox, 17.0% of renting households were paying more than $500 per week in rent in 2018.
Rental payments can be a better measure of the cost of housing in North East Valley Knox than mortgage repayments because they are not contingent on length of occupancy or equity in the dwelling.
High rental payments may indicate desirable areas with mobile populations who prefer to rent, or a housing shortage, or gentrification. Low rental payments may indicate public housing (check Tenure Type), or areas where low income households move by necessity for a lower cost of living.
Rental payments are not directly comparable over time because of inflation. For comparison of rental payments over time, go to Housing Rental Quartiles.
Derived from the Census questions:
'Does this household pay rent to an owner (or to their agent for this dwelling?' and 'How much rent does this household pay to the owner (or agent) for this dwelling?'
Households renting their dwelling
| Weekly housing rental payments | |||||||
|---|---|---|---|---|---|---|---|
| North East Valley Knox | 2018 | ||||||
| Weekly rental amount | Number | % | Musselburgh % | ||||
| < $50 | -- | -- | 1.9 | 581 | |||
| $50 - $74 | -- | -- | 1.9 | 582 | |||
| $75 - $99 | 6 | 1.3 | 1.9 | 583 | |||
| $100 - $124 | 36 | 7.8 | 19.2 | 584 | |||
| $125 - $149 | 15 | 3.3 | 1.9 | 585 | |||
| $150 - $174 | 15 | 3.3 | 3.8 | 586 | |||
| $175 - $199 | 12 | 2.6 | 9.6 | 587 | |||
| $200 - $249 | 54 | 11.8 | 5.8 | 588 | |||
| $250 - $299 | 45 | 9.8 | 7.7 | 589 | |||
| $300 - $349 | 96 | 20.9 | 15.4 | 590 | |||
| $350 - $399 | 48 | 10.5 | 19.2 | 591 | |||
| $400 - $449 | 33 | 7.2 | 3.8 | 592 | |||
| $450 - $499 | 21 | 4.6 | 5.8 | 593 | |||
| $500 - $549 | 18 | 3.9 | 0.0 | 594 | |||
| $550 - $599 | 9 | 2.0 | 0.0 | 595 | |||
| $600 + | 51 | 11.1 | 0.0 | 596 | |||
| Not stated | -- | -- | 1.9 | 600 | |||
| Total households renting | 459 | 100.0 | 100.0 | ||||
Source: Statistics New Zealand, Census of Population and Dwellings (opens a new window)
2018. Compiled and presented in profile.id by .id (opens a new window)
(informed decisions).
Stats NZ data quality rating: Moderate(opens a new window)
Compiled and presented by .id (informed decisions).
Dominant groups
Analysis of the weekly housing rental payments of households in North East Valley Knox compared to the Musselburgh shows that there was a larger proportion of households paying high rental payments ($600 per week or more), and a smaller proportion of households with low rental payments (less than $100 per week).
Overall, 17.0% of households were paying high rental payments, and 1.3% were paying low payments, compared with 0.0% and 5.8% respectively in the Musselburgh.
The major differences between the housing rental payments of North East Valley Knox and the Musselburgh were:
- A larger percentage of $600 + (11.1% compared to 0.0%)
- A smaller percentage of $100 - $124 (7.8% compared to 19.2%)
- A smaller percentage of $350 - $399 (10.5% compared to 19.2%)
- A smaller percentage of $175 - $199 (2.6% compared to 9.6%)