Glenleith
Five year age groups
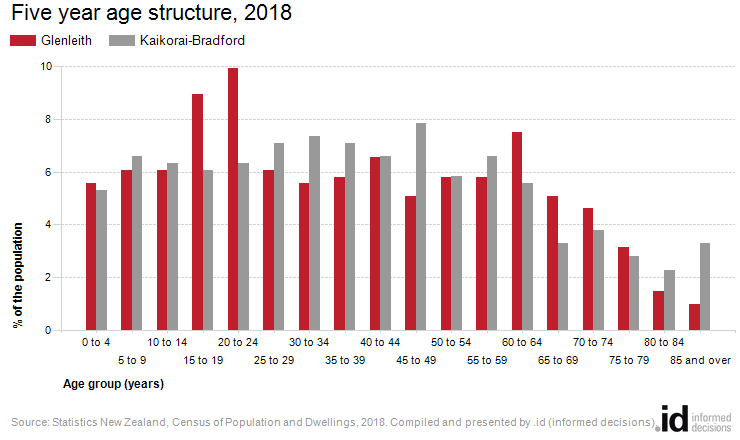
There were 12 [gendersP] over the age of 85 living in Glenleith in 2018, with largest age group being 20 to 24 year olds.
The Age Structure of Glenleith provides key insights into the level of demand for age based services and facilities such as child care. It is also an indicator of Glenleith's residential role and function and how it is likely to change in the future.
Five year age groups present a classic age profile of the population. Each age group covers exactly five years, which enables direct comparison between each group.
To get a more complete picture Glenleith's Age Structure should be viewed in conjunction with Households and Dwelling Type.
Derived from the Census question:
'When were you born?'
Total population
| Age structure - Five year age groups | |||||||||
|---|---|---|---|---|---|---|---|---|---|
| Glenleith | 2018 | 2013 | Change | ||||||
| Five year age groups (years) | Number | % | Kaikorai-Bradford % | Number | % | Kaikorai-Bradford % | 2013 to 2018 | ||
| 0 to 4 | 69 | 5.6 | 5.3 | 54 | 4.8 | 6.4 | +15 | 1001 | 1000 |
| 5 to 9 | 75 | 6.1 | 6.6 | 60 | 5.4 | 6.4 | +15 | 1002 | 1000 |
| 10 to 14 | 75 | 6.1 | 6.3 | 72 | 6.5 | 7.4 | +3 | 1003 | 1000 |
| 15 to 19 | 111 | 9.0 | 6.1 | 78 | 7.0 | 7.1 | +33 | 1004 | 1000 |
| 20 to 24 | 123 | 9.9 | 6.3 | 153 | 13.7 | 7.1 | -30 | 1005 | 1000 |
| 25 to 29 | 75 | 6.1 | 7.1 | 63 | 5.6 | 5.4 | +12 | 1006 | 1000 |
| 30 to 34 | 69 | 5.6 | 7.3 | 66 | 5.9 | 5.9 | +3 | 1007 | 1000 |
| 35 to 39 | 72 | 5.8 | 7.1 | 60 | 5.4 | 7.1 | +12 | 1008 | 1000 |
| 40 to 44 | 81 | 6.5 | 6.6 | 57 | 5.1 | 8.7 | +24 | 1009 | 1000 |
| 45 to 49 | 63 | 5.1 | 7.8 | 69 | 6.2 | 7.1 | -6 | 1010 | 1000 |
| 50 to 54 | 72 | 5.8 | 5.8 | 66 | 5.9 | 6.4 | +6 | 1011 | 1000 |
| 55 to 59 | 72 | 5.8 | 6.6 | 93 | 8.3 | 6.4 | -21 | 1012 | 1000 |
| 60 to 64 | 93 | 7.5 | 5.6 | 69 | 6.2 | 3.8 | +24 | 1013 | 1000 |
| 65 to 69 | 63 | 5.1 | 3.3 | 60 | 5.4 | 4.1 | +3 | 1014 | 1000 |
| 70 to 74 | 57 | 4.6 | 3.8 | 39 | 3.5 | 2.8 | +18 | 1015 | 1000 |
| 75 to 79 | 39 | 3.1 | 2.8 | 27 | 2.4 | 1.8 | +12 | 1016 | 1000 |
| 80 to 84 | 18 | 1.5 | 2.3 | 18 | 1.6 | 3.3 | 0 | 1017 | 1000 |
| 85 and over | 12 | 1.0 | 3.3 | 12 | 1.1 | 2.8 | 0 | 1018 | 1000 |
| Total | 1,239 | 100.0 | 100.0 | 1,116 | 100.0 | 100.0 | +123 | ||
Source: Statistics New Zealand, Census of Population and Dwellings (opens a new window) 2013 and 2018. Compiled and presented in profile.id by .id(opens a new window)(informed decisions).
Stats NZ data quality rating: Very high(opens a new window)
Dominant groups
Analysis of the five year age groups of Glenleith in 2018 compared to the Kaikorai-Bradford shows that there was a lower proportion of [gendersP] in the younger age groups (under 15) and a similar proportion of [gendersP] in the older age groups (65+).
Overall, 17.7% of the [gender] population was aged between 0 and 14, and 15.3% were aged 65 years and over, compared with 18.2% and 15.4% respectively for the Kaikorai-Bradford.
The major differences between the age structure of Glenleith and the Kaikorai-Bradford were:
- A larger percentage of persons aged 20 to 24 (9.9% compared to 6.3%)
- A larger percentage of persons aged 15 to 19 (9.0% compared to 6.1%)
- A smaller percentage of persons aged 45 to 49 (5.1% compared to 7.8%)
- A smaller percentage of persons aged 85 and over (1.0% compared to 3.3%)
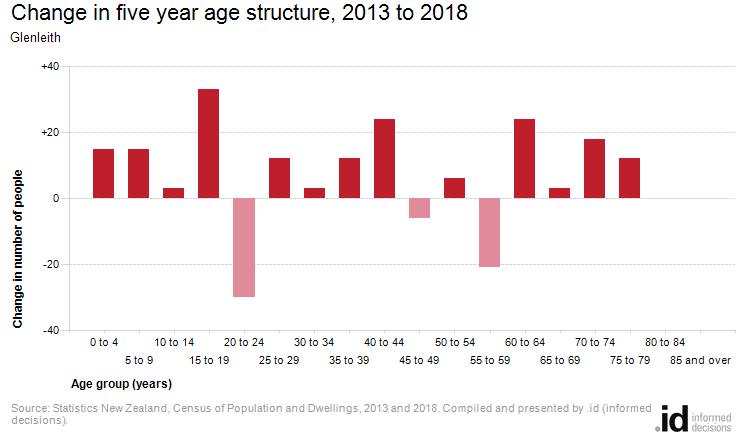
Emerging groups
From 2013 to 2018, Glenleith's [gender] population increased by 123 [gendersP] (11.0%). This represents an average annual population change of 2.11% per year over the period.
There were no major differences in Glenleith between 2013 and 2018.