Andersons Bay
Ethnic groups
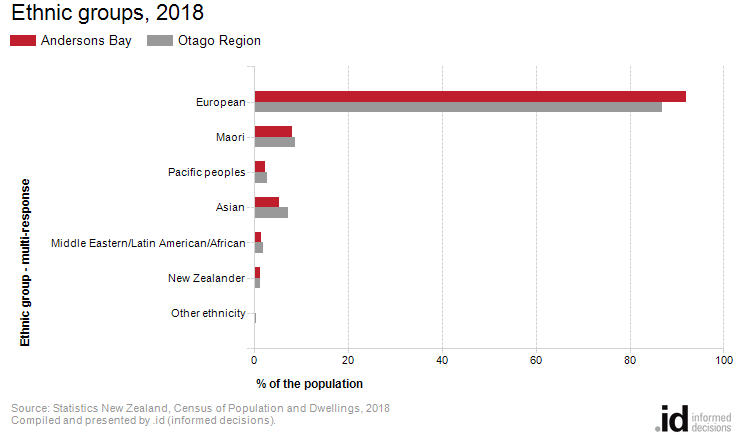
In 2018, 92.1% of the population in Andersons Bay identified their ethnicity as European.
To get a more complete picture of Andersons Bay's cultural and ethnic characteristics Ethnicity data should be viewed in conjunction with Māori Descent, Birthplace, Year of Arrival, Language Spoken and Religion data.
Note: In the 2006 Census, the 'New Zealand' responses were classified under 'Other ethnicity', resulting in a noticeable difference between the 2006 and other census years. For more information, please refer to the Ethnicity page on the Stats NZ Census website.
Derived from the Census question:
'Which ethnic group do you belong to?'.
Multi-response
Total population
| Ethnic groups | |||||||||
|---|---|---|---|---|---|---|---|---|---|
| Andersons Bay | 2018 | 2006 | Change | ||||||
| Ethnic group - multi-response | Number | % of total population | Otago Region % | Number | % of total population | Otago Region % | 2006 to 2018 | ||
| European | 2,190 | 92.1 | 86.9 | 100 | 1,875 | 78.4 | 76.9 | +315 | 1402 |
| Maori | 192 | 8.1 | 8.7 | 102 | 114 | 4.8 | 6.3 | +78 | 1402 |
| 54 | 2.3 | 2.7 | 103 | 21 | 0.9 | 1.6 | +33 | 1402 | |
| 123 | 5.2 | 7.1 | 104 | 51 | 2.1 | 4.0 | +72 | 1402 | |
| Middle Eastern/Latin American/African | 33 | 1.4 | 1.8 | 105 | 12 | 0.5 | 0.7 | +21 | 1402 |
| New Zealander | 30 | 1.3 | 1.2 | 106 | 423 | 17.7 | 13.6 | -393 | 1402 |
| Other ethnicity | 0 | 0.0 | 0.2 | 107 | 3 | 0.1 | 0.0 | -3 | 1402 |
Source: Statistics New Zealand, Census of Population and Dwellings (opens a new window) 2006 and 2018. Compiled and presented in profile.id by .id (opens a new window)(informed decisions).
Stats NZ data quality rating: High(opens a new window)
| Ethnic groups - Totals | ||||||||
|---|---|---|---|---|---|---|---|---|
| Andersons Bay | 2018 | 2006 | Change | |||||
| Ethnic group - totals - multi-response | Number | % of total population | Otago Region % | Number | % of total population | Otago Region % | 2006 to 2018 | |
| Not stated / included | -- | -- | -- | 108 | 18 | 0.8 | 3.4 | -18 |
| Total population | 2,379 | 100.0 | 100.0 | 109 | 2,391 | 100.0 | 100.0 | -12 |
| Total respondents | 2,379 | 100.0 | 100.0 | 111 | 2,373 | 99.2 | 96.6 | +6 |
| Total responses | 2,622 | 110.2 | 108.5 | 112 | 2,499 | 104.5 | 103.1 | +123 |
Source: Statistics New Zealand, Census of Population and Dwellings (opens a new window) 2006 and 2018. Compiled and presented in profile.id by .id (opens a new window)(informed decisions).
Stats NZ data quality rating: High(opens a new window)
Please note that in the 2018 Census, where data are not provided, responses are sourced from administrative datasets, in line with the procedures developed by Statistics New Zealand to supplement the 2018 dataset. Due to this, there is no "Not Stated" category in 2018, and users should use caution when comparing to earlier Census years.
Compiled and presented by .id (informed decisions).
Compiled and presented by .id (informed decisions).
Dominant groups
Analysis of the ethnic population in Andersons Bay in 2018 compared to the Otago Region shows that there was a larger proportion of people who identified themselves as European, a smaller proportion of people who identified themselves as Māori and a similar proportion of people who identified themselves as Pacific Peoples.
Overall, 92.1% of the population identified themselves as European, 8.1% as Māori and 2.3% as Pacific Peoples, compared with 86.9%, 8.7% and 2.7% for the Otago Region respectively.
The major differences between the ethnic groups responses of the population in Andersons Bay and the Otago Region were:
- A larger percentage of responses to European ethnic group (92.1% compared to 86.9%)
- A smaller percentage of responses to Asian ethnic group (5.2% compared to 7.1%)
Note: Percentages(%) are based on total population
Emerging groups
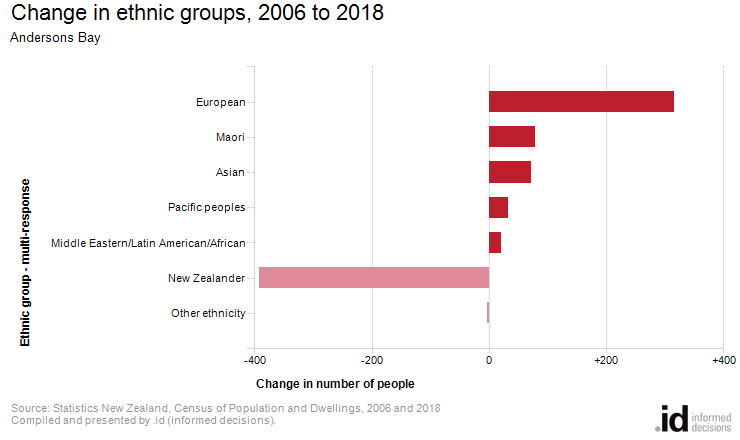
The largest changes in the ethnic group responses of population in this area between 2006 and 2018 were:
- New Zealander (-393 responses)
- European (+315 responses)
- Māori (+78 responses)
- Asian (+72 responses)