Arthur Street
Number of cars per household
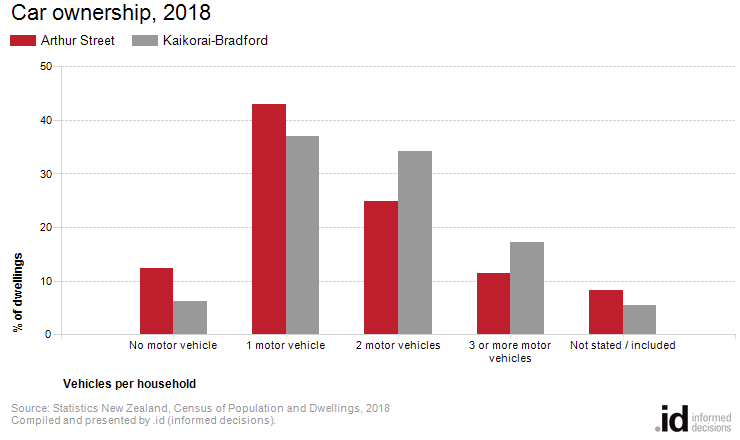
Analysis of car ownership in 2018, indicates 36.3% of households in Arthur Street had access to two or more motor vehicles, compared to 51.4% in the Kaikorai-Bradford.
The ability of the population to access services and employment is strongly influenced by access to transport. The number of motor vehicles per household in Arthur Street quantifies access to private transport and will be influenced by Age Structure and Household Type, which determine the number of adults present; access to Public Transport; distance to shops, services, employment and education; and Household Income. Depending on these factors, car ownership can be seen as a measure of advantage or disadvantage, or a neutral socio-economic measure, which impacts on the environment and quality of life.
Please note: Stats NZ has given number of cars data for the 2018 Census a quality rating of "moderate". This is due to a higher non-response rate for 2018, and no alternative data sources have been used. It is possible that any change in categories may be due to the higher "Not stated" component and users should use caution in comparing over time. See Stats NZ’s DataInfo+ for specific information on what this rating means and recommendations for use.
Derived from the Census question:
'How many motor vehicles (not counting motorbikes) do the people who live here have available for their use?'
Occupied private dwellings
| Car ownership | |||||||||
|---|---|---|---|---|---|---|---|---|---|
| Arthur Street | 2018 | 2013 | Change | ||||||
| Number of cars | Number | % of households | Kaikorai-Bradford % | Number | % of households | Kaikorai-Bradford % | 2013 to 2018 | ||
| 72 | 12.4 | 6.2 | 84 | 16.0 | 6.9 | -12 | 620 | 14170 | |
| 1 motor vehicle | 249 | 43.0 | 37.0 | 237 | 45.1 | 37.5 | +12 | 621 | 14170 |
| 144 | 24.9 | 34.2 | 117 | 22.3 | 33.3 | +27 | 622 | 14170 | |
| 3 or more motor vehicles | 66 | 11.4 | 17.1 | 51 | 9.7 | 16.0 | +15 | 623 | 14170 |
| Not stated / included | 48 | 8.3 | 5.5 | 36 | 6.9 | 6.3 | +12 | 624 | 14170 |
| Total households | 579 | 100.0 | 100.0 | 525 | 100.0 | 100.0 | +54 | ||
Source: Statistics New Zealand, Census of Population and Dwellings (opens a new window)
2013 and 2018. Compiled and presented in profile.id by .id (opens a new window)
(informed decisions).
Stats NZ data quality rating: Moderate(opens a new window)
Compiled and presented by .id (informed decisions).
Compiled and presented by .id (informed decisions).
Dominant groups
Analysis of the car ownership of the households in Arthur Street in 2018 compared to the Kaikorai-Bradford shows that 79.3% of the households owned at least one car, while 12.4% did not, compared with 88.4% and 6.2% respectively in the Kaikorai-Bradford.
Of those that owned at least one vehicle, there was a larger proportion who owned just one car; a smaller proportion who owned two cars; and a smaller proportion who owned three cars or more.
Overall, 43.0% of the households owned one car; 24.9% owned two cars; and 11.4% owned three cars or more, compared with 37.0%; 34.2% and 17.1% respectively for the Kaikorai-Bradford.
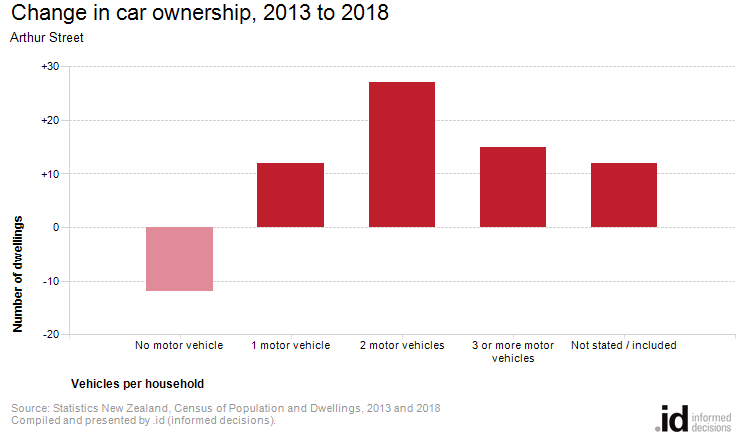
Emerging groups
There were no major differences in Arthur Street between 2013 and 2018.